Genomic data derived from tumour samples can provide a wealth of information about molecular pathways driving tumour development, predict tumour response to treatment, and refine or confirm patient diagnosis and prognosis.1 However, sequencing a whole genome generates gigabases of sequencing data, requiring extensive analytical power and technical expertise to translate raw data into clinically actionable findings.2 The Genomics England bioinformatics pipeline has been designed to standardise interpretation workflows for whole genome sequencing (WGS) data across Genomic Laboratory Hubs and to facilitate implementation of clinical WGS at scale.
WGS test design
In the standard design for WGS in cancer, a tumour sample is matched to a reference normal sample obtained from the same patient, typically derived from a peripheral blood, saliva or skin biopsy sample. High-quality genomic DNA collected from the tumour and normal samples undergo library preparation, sequencing and data pre-processing that translate sequencing signals (e.g. fluorescent images for Illumina sequencing or changes to an electrical current for Oxford Nanopore Technology) into base calls (A, T, C and G).
Mapping and variant calling
Sequencing of the genome is performed by reading short fragments of DNA, with each base in the genome being sequenced multiple times from independent DNA fragments (approximately 30-times for normal samples and 100-times for tumour samples).
By sequencing both tumour and normal samples, variants that are found only in the tumour sample (somatic mutations) can be identified by subtraction of variants that are also found in the normal sample.
As outlined by Philip Elliott and Louise Jones in their article (pp 483–485), using short-read technologies (e.g. Illumina), fragments of approximately 400 base pair (bp) in length are sequenced with 150 bp reads from each end, while long-read technologies can routinely generate reads of tens of thousands of base pairs in length. Each of the sequenced reads is aligned to a standard reference genome sequence. Next, the sequence in the aligned fragments is compared with the equivalent region of the reference sequence and differences are identified in a process known as variant calling.
By sequencing both tumour and normal samples, variants that are found only in the tumour sample (somatic mutations) can be identified by subtraction of variants that are also found in the normal sample. Interpretation of somatic mutations can be particularly challenging as some tumour types can carry tens or even hundreds of thousands of somatic mutations, yet only a small number justify clinical review. Therefore, variant prioritisation is essential, but requires careful design and implementation to ensure that clinically relevant variants are not missed.3 This complex, multi-step process of genome analysis can be implemented as an automated pipeline to ensure fast processing of patient genomic data and generation of reproducible outcomes.
Since the introduction of WGS by Illumina in 2007, dozens of algorithms for alignment and variant calling have been published.4 There are several factors that need to be considered while selecting tools for WGS analysis: speed, accuracy and compatibility with downstream tools. To ensure compatibility of tools for different steps of the analytical pipeline, standard formats were introduced for files containing information for aligned sequencing data (binary alignment map) or variants data (variant call format). Since each genomic region is sequenced multiple times, gigabases of data are generated for each sequenced genome, therefore alignment and variant calling are computationally intensive tasks. However, high depth is required to mitigate problems owing to unavoidable noise in sequencing and base calling, uneven distribution of sequenced DNA fragments along the reference genome and intrinsic tumour heterogeneity.
There are several types of clinically actionable genomic variants that can be derived from WGS. Different, bespoke variant calling tools are required for different types of variation. For use in clinical practice, it is essential to select variant calling tools that provide high sensitivity and specificity of variant detection. Tumour and normal samples are analysed jointly to avoid reporting variants that are clearly present in the germline. However, detecting subclonal somatic mutations present in only a subset of tumour cells is particularly challenging owing to limited tumour sampling or insufficient sequencing depth.
WGS analysis allows genome-wide detection of small variants (single base substitutions or small insertion or deletion events), copy number aberrations (CNAs) and large structural variants (SVs). It provides much higher resolution than standard of care cytogenetic analysis and a much broader view of the genome than fluorescence in situ hybridisation tests that are limited to one or two genes. CNAs (chromosomal gains and losses) are identified by the change in depth of read coverage and deviation of B-allele frequency. This approach has its limitations, as most CNA callers are not able to detect subclonal variants.
By sequencing fragments from both ends, SVs can be identified when the alignment of the two reads in a pair is not consistent with what is expected from the reference genome, either the distance between the reads or the relative orientation.5
The small variants identified can be used to perform genome-wide characterisation of the tumour, for example, assessment of tumour mutation burden or mutational signatures (analysis of somatic mutation patterns in trinucleotide groups).6
However, the complexity of the genome introduces challenges for both alignment and variant calling. Some sequencing reads cannot be unambiguously mapped to the reference genome, such as reads that originate from the regions of segmental duplication, blocks of DNA that occur at more than one site within the genome and typically share a high level (>90%) of sequence identity. Such reads will be assigned low mapping quality and true variants in these regions can go undetected. Some positions in the genome are prone to sequencing mistakes and, owing to comparatively shallow sequencing of normal samples, these artificial mismatches can be misreported as somatic variants. However, these errors can be identified by using data derived from large cohorts of normal samples and flagging potential false-positive variants in recurrently problematic regions.
Annotation and interpretation
After variants have been confidently identified, the next step is to annotate their predicted consequence, pathogenicity and actionability.3 This is performed by predicting the impact of variants on the genes in which they reside and by annotation with a range of publicly available biological data.
Single variant substitutions and small insertions or deletions can cause either loss-offunction mutations in tumour suppressor genes or activating mutations in oncogenes. Large SVs (translocations, deletions, duplications and inversions) are emerging as important targets for new therapies and prognostic/diagnostic markers. The high resolution of WGS allows identification of the precise location of fusion breakpoints, which then enables resolution of whether the potential fusion protein would preserve the open reading frame.
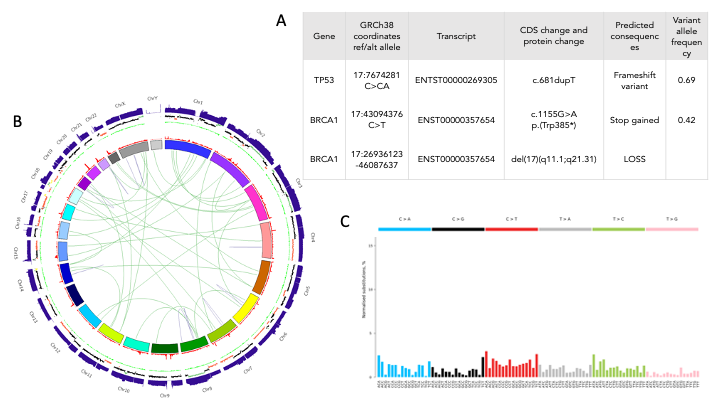
In Figure 1, we present an example of interpretation of WGS data derived from a high-grade serous ovarian carcinoma (HGSOC) tumour sample. Presence of a frameshift insertion (insertion of a single A) in the TP53 gene (Figure 1A) is in agreement with the high prevalence of TP53 mutations in HGSOC (at least 96%).7 Review of somatic variants also highlighted the presence of a premature stop codon mutation in the BRCA1 gene, which is annotated as pathogenic with high confidence in the ClinVar database. Analysis of CNAs also reported the loss of the second copy of the BRCA1 gene.
An overview of this genome is presented in Figure 1B with the absolute depth of coverage in the tumour sample and normalised coverage with CNAs (gain in green and loss in red) presented
on the two outermost tracks. The entire long arm of chromosome 17 (17q) that carries the BRCA1 gene is showing reduced read coverage that is reported as a loss of one copy del(17 (q11.1;q21.31). Deleterious mutations in BRCA1 are known to cause homologous recombination deficiency (HRD),8 which is supported by mutational signature analysis for this tumour (Figure 1C; the signature for HRD has a very flat pattern across tri-nucleotide patterns). Recently approved NICE guidance for ovarian patients with HRD makes this patient eligible for olaparib treatment.9
It is an exciting time in cancer genomics. The latest genomic advances can now be translated into clinical care for cancer patients within the framework of NHSE.
Quality control of sequencing data
Extensive quality control is required to ensure high-quality data is provided for patient care. The quality control steps performed in the pipeline include confirmation that:
- samples (tumour and normal) are not contaminated by DNA from another patient
- sequencing data are of sufficient quality with uniform coverage, the DNA fragment has a length of ~400 bp, there is a high mapping rate of sequenced reads to the reference genome and there is a low number of chimeric fragments
- tumour content (purity or cellularity) is above the limit of detection for somatic variants (>30%)
- tumour in normal contamination (TINC) level for haematological samples is low. High TINC prevents inappropriate subtraction of true somatic variants resulting in false positives.
It is an exciting time in cancer genomics. The latest genomic advances can now be translated into clinical care for cancer patients within the framework of NHSE. The high-resolution analysis made possible by WGS allows for better understanding of genome biology. The unprecedented amount of genomic data generated through the Genomic Medicine Service can be used for research that will lead to advances in sequencing and analytical technologies, developing our understanding of cancer biology, and ultimately leading to further improvements in patient care.
Author(s)

Dr Alona Sosinsky, PhD

Dr Susan Walker